Know where your music’s taking you
Your music is everywhere, played and performed across the globe. But you need the data all in one place. Open the new Analytics feature in your digital statements and you’ll be able to see just how your music is making you money. Whether you’re looking at the bigger picture or focusing on the details, Analytics puts you in control of the view.
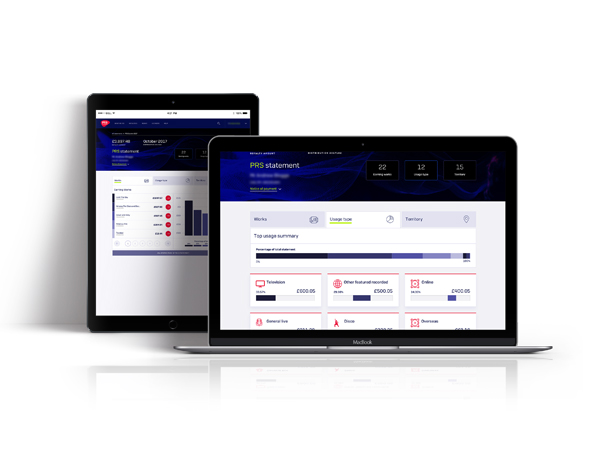
Create snapshot views
With the Analytics feature, you can spin up graphs in no time. Just select the time period and works you want to review. Then select the territory. You can even switch the graph view between bar chart and line. Choose how you view the trends and opportunities that could be informing your next campaign or business decision.
Make easy comparisons
The Analytics feature also lets you compare up to three works in one view, so you can build a comparison picture based on work, usage and territory. You can even split this across performing and mechanical royalties. Great if you’re measuring impact or looking for areas that need a push.
Dive into the detail
Do you need to check the royalty distribution for a single work across distributions? Or maybe you’re making a specific enquiry for usage in a particular territory. Whatever your focus, the Analytics features gets you to the detail in a few minutes or less. No need to comb through PDFs or spreadsheets. No need to raise a query and wait for the answer.
Dice and slice your royalty data
You can easily access the Analytics feature in your Statements. If you’re not a PRS member yet, we hope you’ve read this far because you’re interested in joining. Please take a look around our site. Then check out our joining page to see if we’re the right fit for you and your music.